Installation troubleshooting
1. The cluster doesn't connect
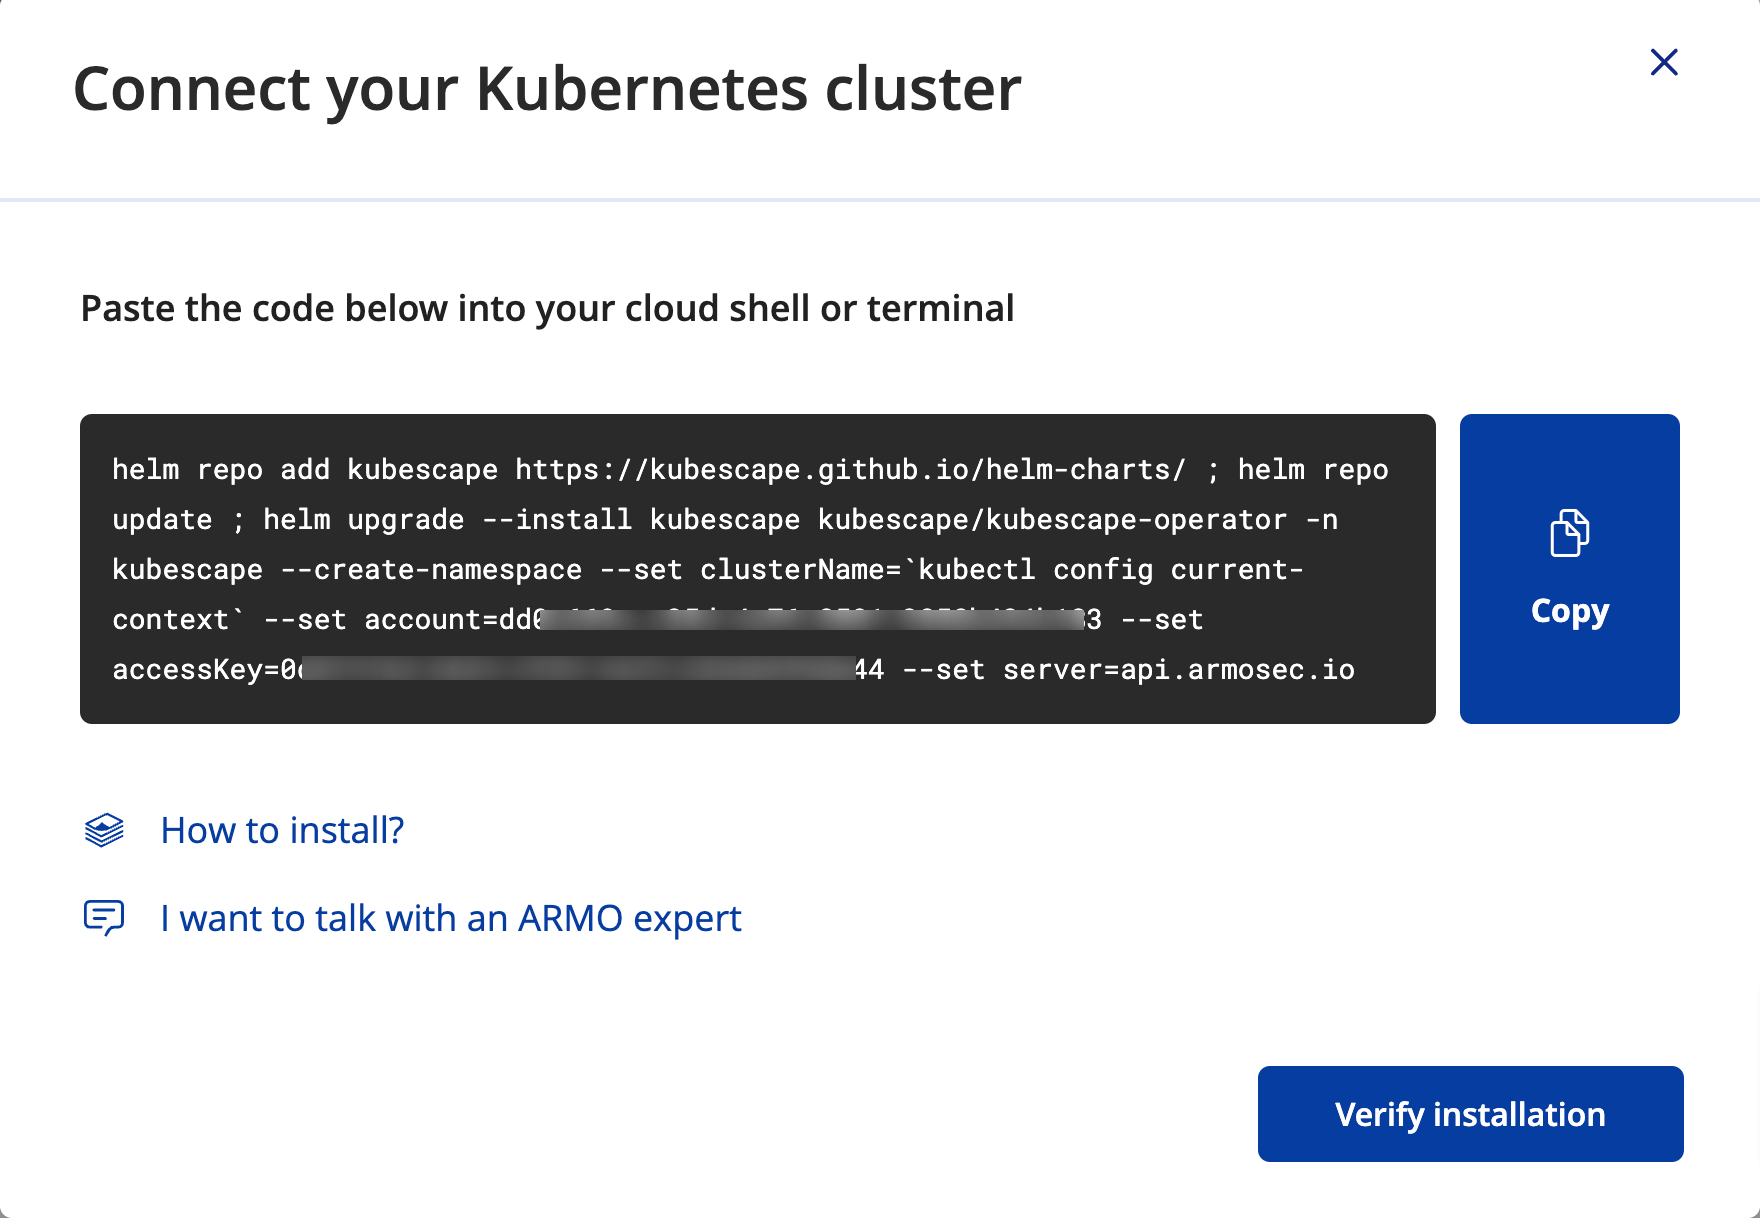
When attempting to connect to your Kubernetes cluster, you receive a connection error.
Solutions
Run the Helm snippet again
The Helm command might not have run. Copy all the code in the cluster connection dialog and run it in your cluster.
2. Scanning results aren't available
After running the Helm install and seeing that the cluster is connected, the UI does not forward you to the results page
Solutions
Refresh the page
Sometimes, the best solution is to simply refresh your webpage.
Ensure the Kubescape and kubevuln pods are running
You may find that one or more pods are not running after installation. Run the following:
kubectl -n kubescape get podsBelow you can see that only one pod is not running:
NAME                          READY   STATUS    RESTARTS   AGE
kubescape-744bc74f8c-z9drg    0/1     Pending   0          5m38s
kubevuln-7648c9c88f-6q7zd     0/1     Pending   0          5m38s
operator-5c86b8f97d-59nw5     1/1     Running   0          5m38s
Check the status of the pods that aren't running as follows:
kubectl -n kubescape describe pod <podname>Below, the pod kubescape-744bc74f8c-z9drg has insufficient CPU in the Events section, at the bottom.
Name:         kubescape-744bc74f8c-z9drg
Namespace:    kubescape
Priority:     0
Node:         cluster-8260/192.168.58.2
Start Time:   Tue, 07 Mar 2023 12:33:33 +0200
Labels:       app=kubescape
              app.kubernetes.io/instance=kubescape
              app.kubernetes.io/name=kubescape
              helm.sh/chart=kubescape-cloud-operator-1.10.3
              helm.sh/revision=2
              pod-template-hash=5cff758d74
              tier=ks-control-plane
Annotations:  <none>
Status:       Running
IP:           172.17.0.9
IPs:
  IP:           172.17.0.9
Controlled By:  ReplicaSet/kubescape-5cff758d74
Containers:
  kubescape:
    Container ID:  docker://d6f8a3c613f2ea774e5f8458554b7d70a0b4694370ea6cb522ad5a96c777fdef
    Image:         quay.io/kubescape/kubescape:v2.2.4
    Image ID:      docker-pullable://quay.io/kubescape/kubescape@sha256:91d1ad9bf22757b972324a3909da05dbcd9bff9ed4544d04e85a47e7069b65eb
    Port:          8080/TCP
    Host Port:     0/TCP
    Command:
      ksserver
    State:          Running
      Started:      Tue, 07 Mar 2023 12:33:52 +0200
    Ready:          True
    Restart Count:  0
    Limits:
      cpu:     600m
      memory:  800Mi
    Requests:
      cpu:      250m
      memory:   400Mi
    Mounts:
      /home/ks/.kubescape/config.json from kubescape-config-volume (rw,path="config.json")
      /home/ks/.kubescape/host-scanner.yaml from host-scanner-definition (rw,path="host-scanner-yaml")
      /var/run/secrets/kubernetes.io/serviceaccount from kube-api-access-4fh8f (ro)
Conditions:
  Type              Status
  Initialized       True
  Ready             True
  ContainersReady   True
  PodScheduled      True
Volumes:
  kubescape-config-volume:
    Type:      ConfigMap (a volume populated by a ConfigMap)
    Name:      kubescape-config
    Optional:  false
  host-scanner-definition:
    Type:      ConfigMap (a volume populated by a ConfigMap)
    Name:      host-scanner-definition
    Optional:  false
  kube-api-access-4fh8f:
    Type:                    Projected (a volume that contains injected data from multiple sources)
    TokenExpirationSeconds:  3607
    ConfigMapName:           kube-root-ca.crt
    ConfigMapOptional:       <nil>
    DownwardAPI:             true
QoS Class:                   Burstable
Node-Selectors:              <none>
Tolerations:                 node.kubernetes.io/not-ready:NoExecute op=Exists for 300s
                             node.kubernetes.io/unreachable:NoExecute op=Exists for 300s
Events:
  Type     Reason             Age                From                Message
  ----     ------             ----               ----                -------
  Warning  FailedScheduling   6m1s               default-scheduler   0/1 nodes are available: 1 Insufficient cpu. preemption: 0/1 nodes are available: 1 No preemption victims found for incoming pod.
  Warning  FailedScheduling   52s                default-scheduler   0/1 nodes are available: 1 Insufficient cpu. preemption: 0/1 nodes are available: 1 No preemption victims found for incoming pod.
  Normal   NotTriggerScaleUp  1s (x6 over 5m2s)  cluster-autoscaler  pod didn't trigger scale-up:
Solution
The cluster had a single node assigned. Increasing the node count addressed the problem and the remaining ARMO in-cluster pods automatically started once the additional nodes were available.
Check your admission controllers
We have seen cases where kubevuln pods were rejected by some admission controllers because they exceeded the maximum memory limit permitted.
Please check the ReplicaSet statuses for any indication and you can override the default memory limit by adding this snippet to the helm command:
--set kubevuln.resources.limits.memory=2Gi3. The Kubescape pod restarted
You may find that the Kubescape pod restarted, this means Kubescape probably did not complete the scan. Run the following command:
kubectl -n kubescape get pods | grep kubescapeYou should see the following output:
NAME                          READY   STATUS    RESTARTS   AGE
kubescape-744bc74f8c-z9drg    1/1     Running   1          5m38s
Solutions
Typically the restart is caused by memory issues.
Increase the memory request and CPU
We recommend increasing the memory request and CPU (by editing the Deployment):
kubectl -n kubescape edit deployment kubescapeAfter the kubescape pod is ready, restart the operator pod:
kubectl -n kubescape rollout restart deployment operatorRe-install the Helm chart
Re-install the Helm chart and manually set the requested memory/CPU (add this to the helm upgrade --install command):
--set kubescape.resources.requests.memory=800Mi \
--set kubescape.resources.limits.memory=1500Mi \
--set kubescape.resources.requests.cpu=500m \
--set kubescape.resources.limits.cpu=1000m
4. Missing Runtime Information
Certain functionalities, such as Network Policy generation and identification of relevant vulnerabilities, rely on data gathered from the application during its runtime.
If the anticipated information is unavailable, we suggest the following steps for users to troubleshoot on their own. Of course, don't hesitate to contact us through Slack or GitHub issues for further assistance.
4.1 Node Agent Monitoring
The component responsible for monitoring applications during runtime is the node-agent DaemonSet.
Verify that the DaemonSet is actively running on all your nodes.
In case the pods are running exclusively on specific nodes, ensure that you update the node-affinity settings to permit the node-agent to operate on all nodes where your applications are active and you intend to monitor.
4.2 Node Agent in Crash Loop
If the node-agent is consistently in a crash loop, there are several potential reasons. We recommend checking the logs, as they typically contain valuable information. Below are some common scenarios:
4.2.1 Unsupported Kernel Version
The node-agent relies on eBPF technology, which is exclusively implemented on Linux kernels. Consequently, this feature is only functional on Linux distributions, and the Linux kernel version on the node must be >= 5.4.
4.2.2 RunC Not Found
To observe system call activity, the node-agent relies on RunC. If the logs suggest that RunC is missing, make sure to include the path as an environment variable. For example, set it as follows: RUNTIME_PATH=/path/to/runc/on/the/node, or during the installation of the kubescape-operator, use: --set global.overrideRuntimePath=/path/to/runc/on/the/node.
An example of the log is provided below:
{"level":"fatal","ts":"2023-12-10T18:21:39Z","msg":"error starting the container watcher","error":"setting up container collection: initializing container collection: starting runc fanotify: no runc instance can be monitored with fanotify. The following paths were tested: /bin/runc,/usr/bin/runc,/usr/sbin/runc,/usr/local/bin/runc,/usr/local/sbin/runc,/usr/lib/cri-o-runc/sbin/runc,/run/torcx/unpack/docker/bin/runc,/usr/bin/crun. You can use the RUNC_PATH env variable to specify a custom path. If you are successful doing so, please open a PR to add your custom path to runcPaths"}If you aren't sure where runc is located, you can run the following command on the node to find it:
find / -name runc 2>/dev/nullIn case you are in an environment where you can't access the node, one solution is to run a privileged pod on the node and run the command from there. To create a privileged pod, run the following command:
kubectl run --rm -i --tty busybox --image=busybox --restart=Never --overrides='{"apiVersion":"v1","spec":{"containers":[{"name":"busybox","image":"busybox","command":["/bin/sh"],"stdin":true,"tty":true,"securityContext":{"privileged":true},"volumeMounts":[{"mountPath":"/host","name":"host-root"}]}],"volumes":[{"name":"host-root","hostPath":{"path":"/","type":""}}]}}' -- /bin/shBottlerocket users
AWS Bottlerocket nodes are especially well protected, but their configuration is somewhat unique. See a bit more about the problem here.
To be able to run Kubescape Operator with the eBPF node agent on these nodes, use the following configuration in Helm to properly set up seLinux:
helm install/upgrade ... --set kubescape-operator.nodeAgent.seLinuxType=super_tRHEL 9 nodes
There is a known issue when running on RHEL 9. Here is how you can work around it:
Although the kernel version typically remains unchanged throughout the lifespan of a RHEL release, there is a method to install a newer version. Follow the instructions on this installation page and install the latest long-term support branch.
4.3 Restarting Workloads
Internally, the node-agent actively monitors containers from the inception of their life cycle. Our research indicates that over 90% of a container's unique file and network activity occurs within the initial few minutes of startup. Consequently, we opted to commence monitoring only from the container's startup.
In cases where the node-agent pod initiates after the container, the container won't get monitored and, as a result, won't possess any associated runtime information.
To ensure optimal utilization, please restart your workloads after installing the kubescape-operator. This ensures that you maximize the benefits of the monitoring process.
4.4 Data Availability Delay
The node-agent begins monitoring data before processing it, and this process typically takes a few minutes. If you've recently installed the kubescape-operator or restarted the workload, kindly allow a few minutes for the monitoring and processing to commence.
4.5 Other Considerations
Due to the intricacies of this solution, there are a couple of scenarios to be mindful of:
-
Insufficient Workload Runtime:
If the workload didn't run for a sufficient duration or if the node-agent underwent a restart, it might lead to the loss of monitored data. Consequently, insights for such workloads may not be available. -
Storage Component Issues:
Another potential issue could arise if thestoragecomponent encounters problems, leading to its unavailability. This can result in delays and potential data loss. If you encounter such issues, please investigate the status of thestoragecomponent for resolution.
Updated 2 months ago