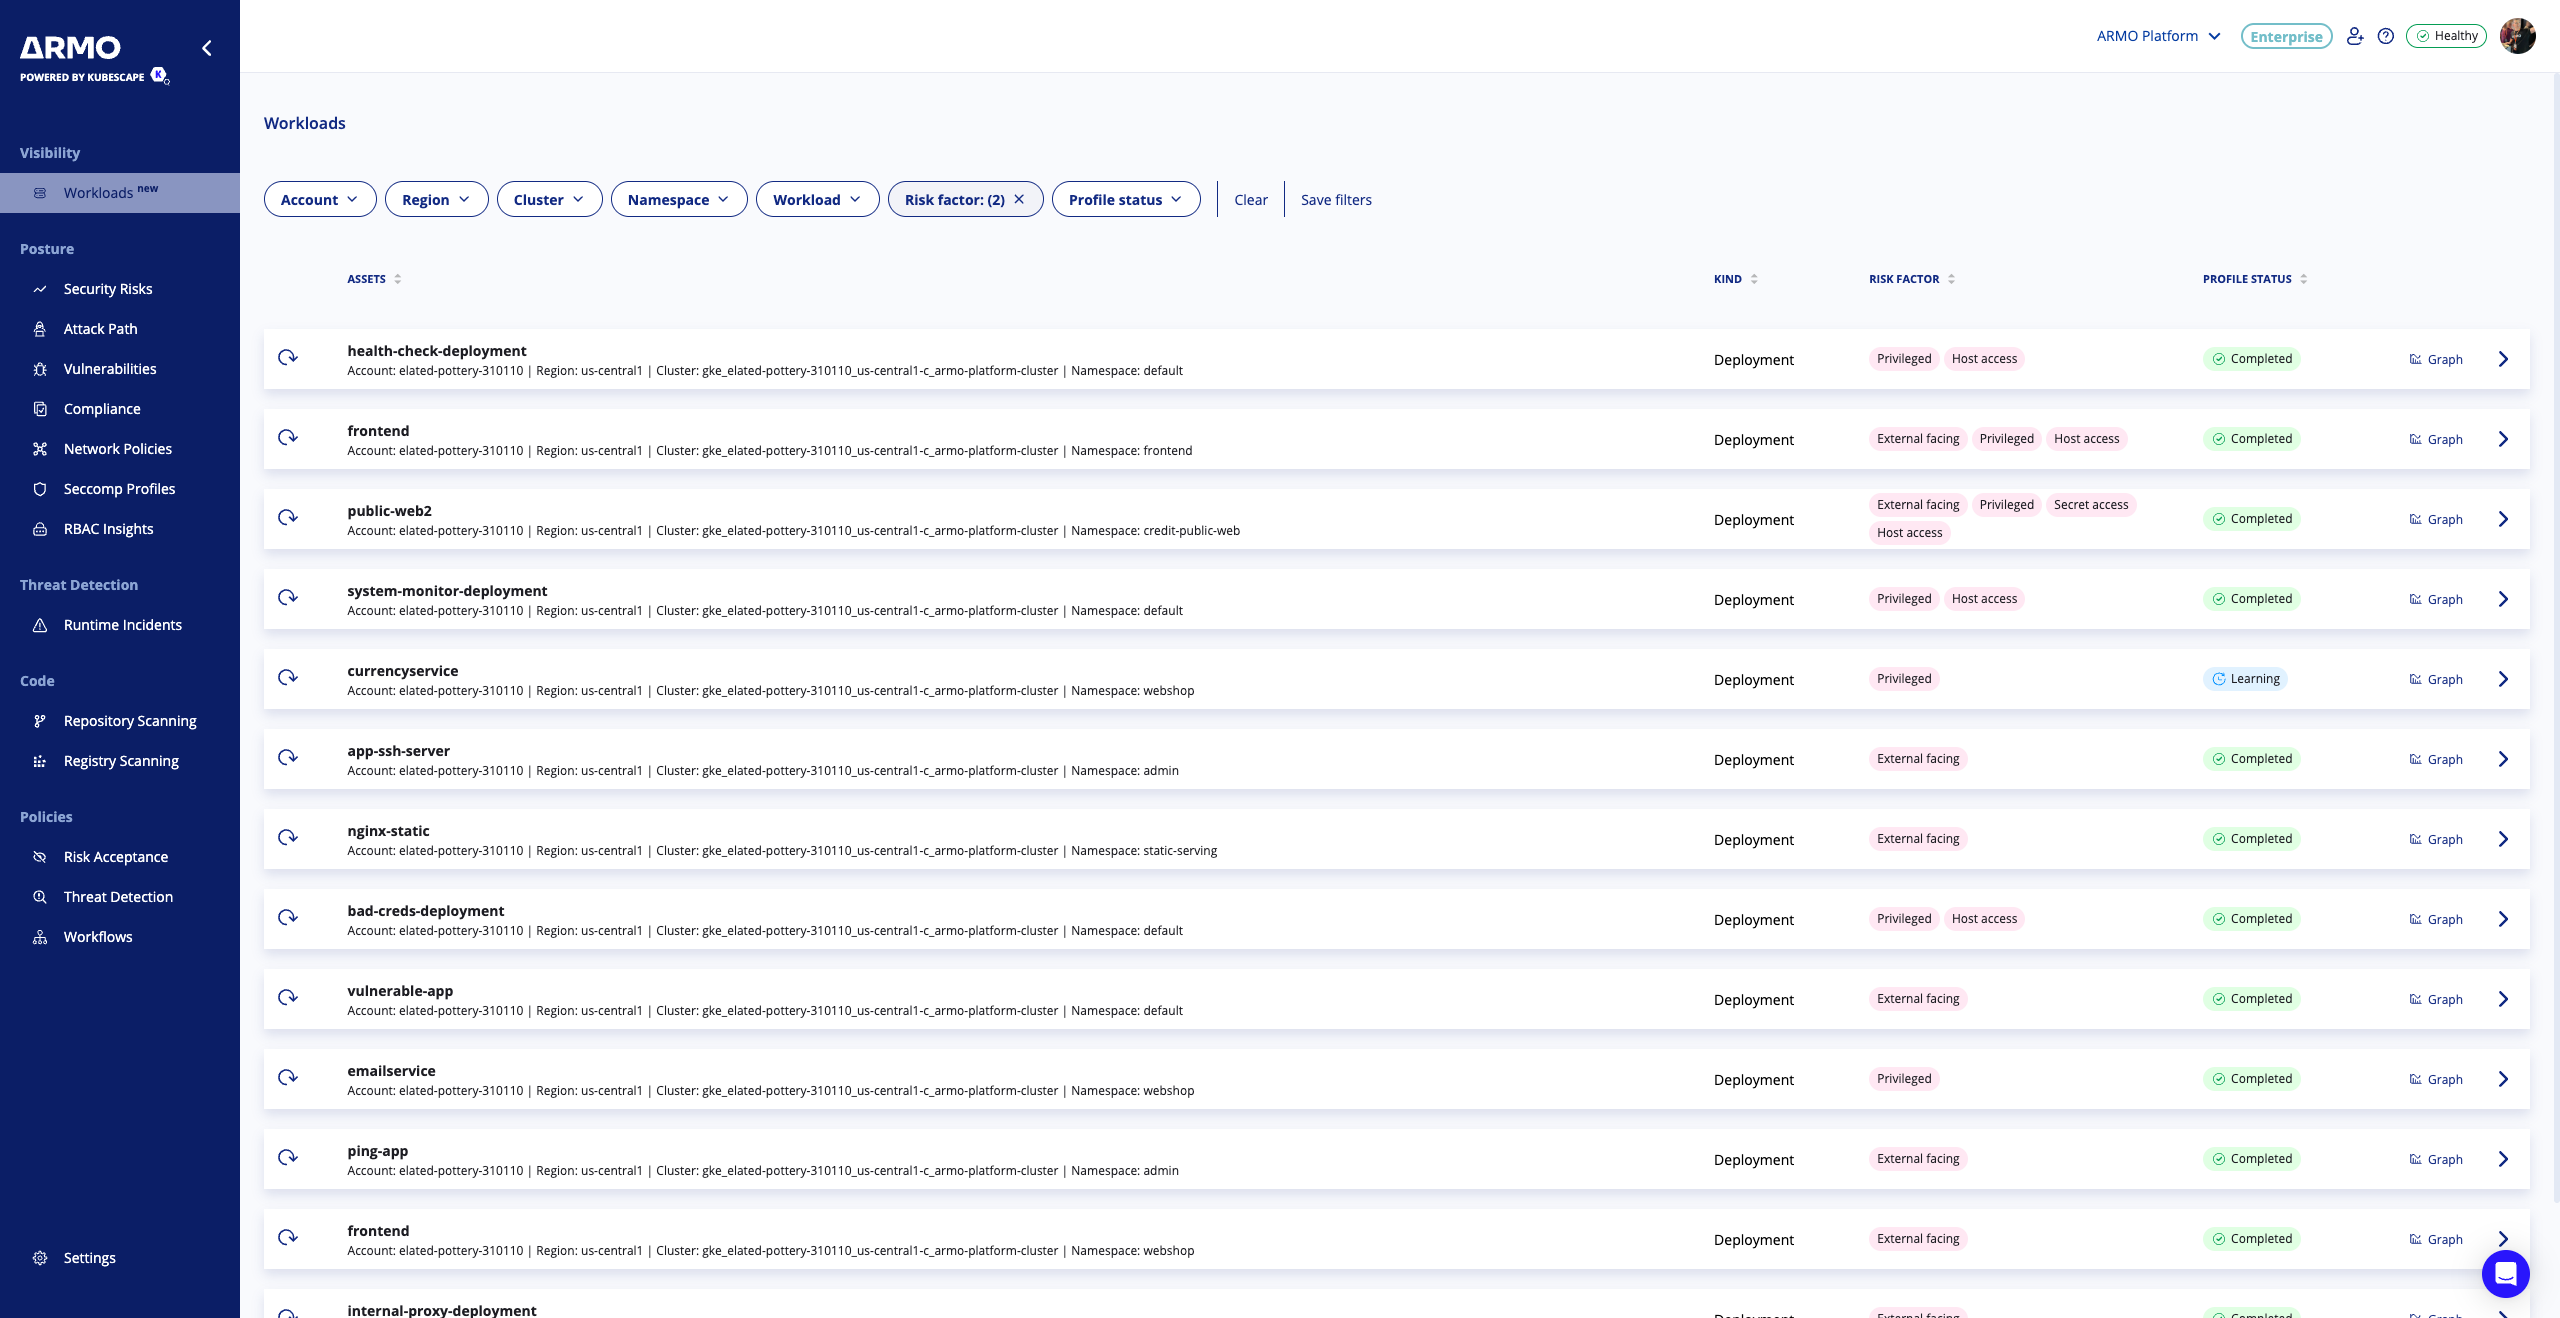
Workloads
Overview
The Workload View provides a comprehensive inventory of all Kubernetes workloads in your cluster. It enables users to assess workload-level risk and behavior using tabular insights and contextual visualizations. It allows users to:
- Identify workloads with elevated security risks
- Track profiling status and visibility coverage
- Drill down into workload-specific details
Table Columns
Each row in the workload table includes the following information:
- Asset
- Kind
- Risk Factor
- Application Profile Status
Risk Factors
Workloads are evaluated based on runtime and configuration insights. The following risk factors may be displayed:
| Risk Factor | Description |
|---|---|
| Internet facing | This workload is publicly reachable and exposed to external network traffic |
| External facing | The workload is accessible from outside the cluster or internet-exposed |
| Privileged | The workload runs in privileged mode or uses elevated permissions. |
| Secret Access | The workload has access to Kubernetes secrets. |
| Host Access | The workload can access the host system (e.g., via hostPath volumes). |
| Data Access | The workload accesses sensitive or persistent storage resources. |
Application Profile Status
The profiling engine monitors runtime behavior and evaluates workloads against observed activity. Status types:
| Status | Meaning |
|---|---|
| Completed | Profiling is complete with sufficient runtime data. |
| Learning | Profiling is in progress; more data is being collected. |
| Missing | No profile data available due to insufficient visibility or coverage. |
| Failed | Profiling failed due to an internal error or misconfiguration |
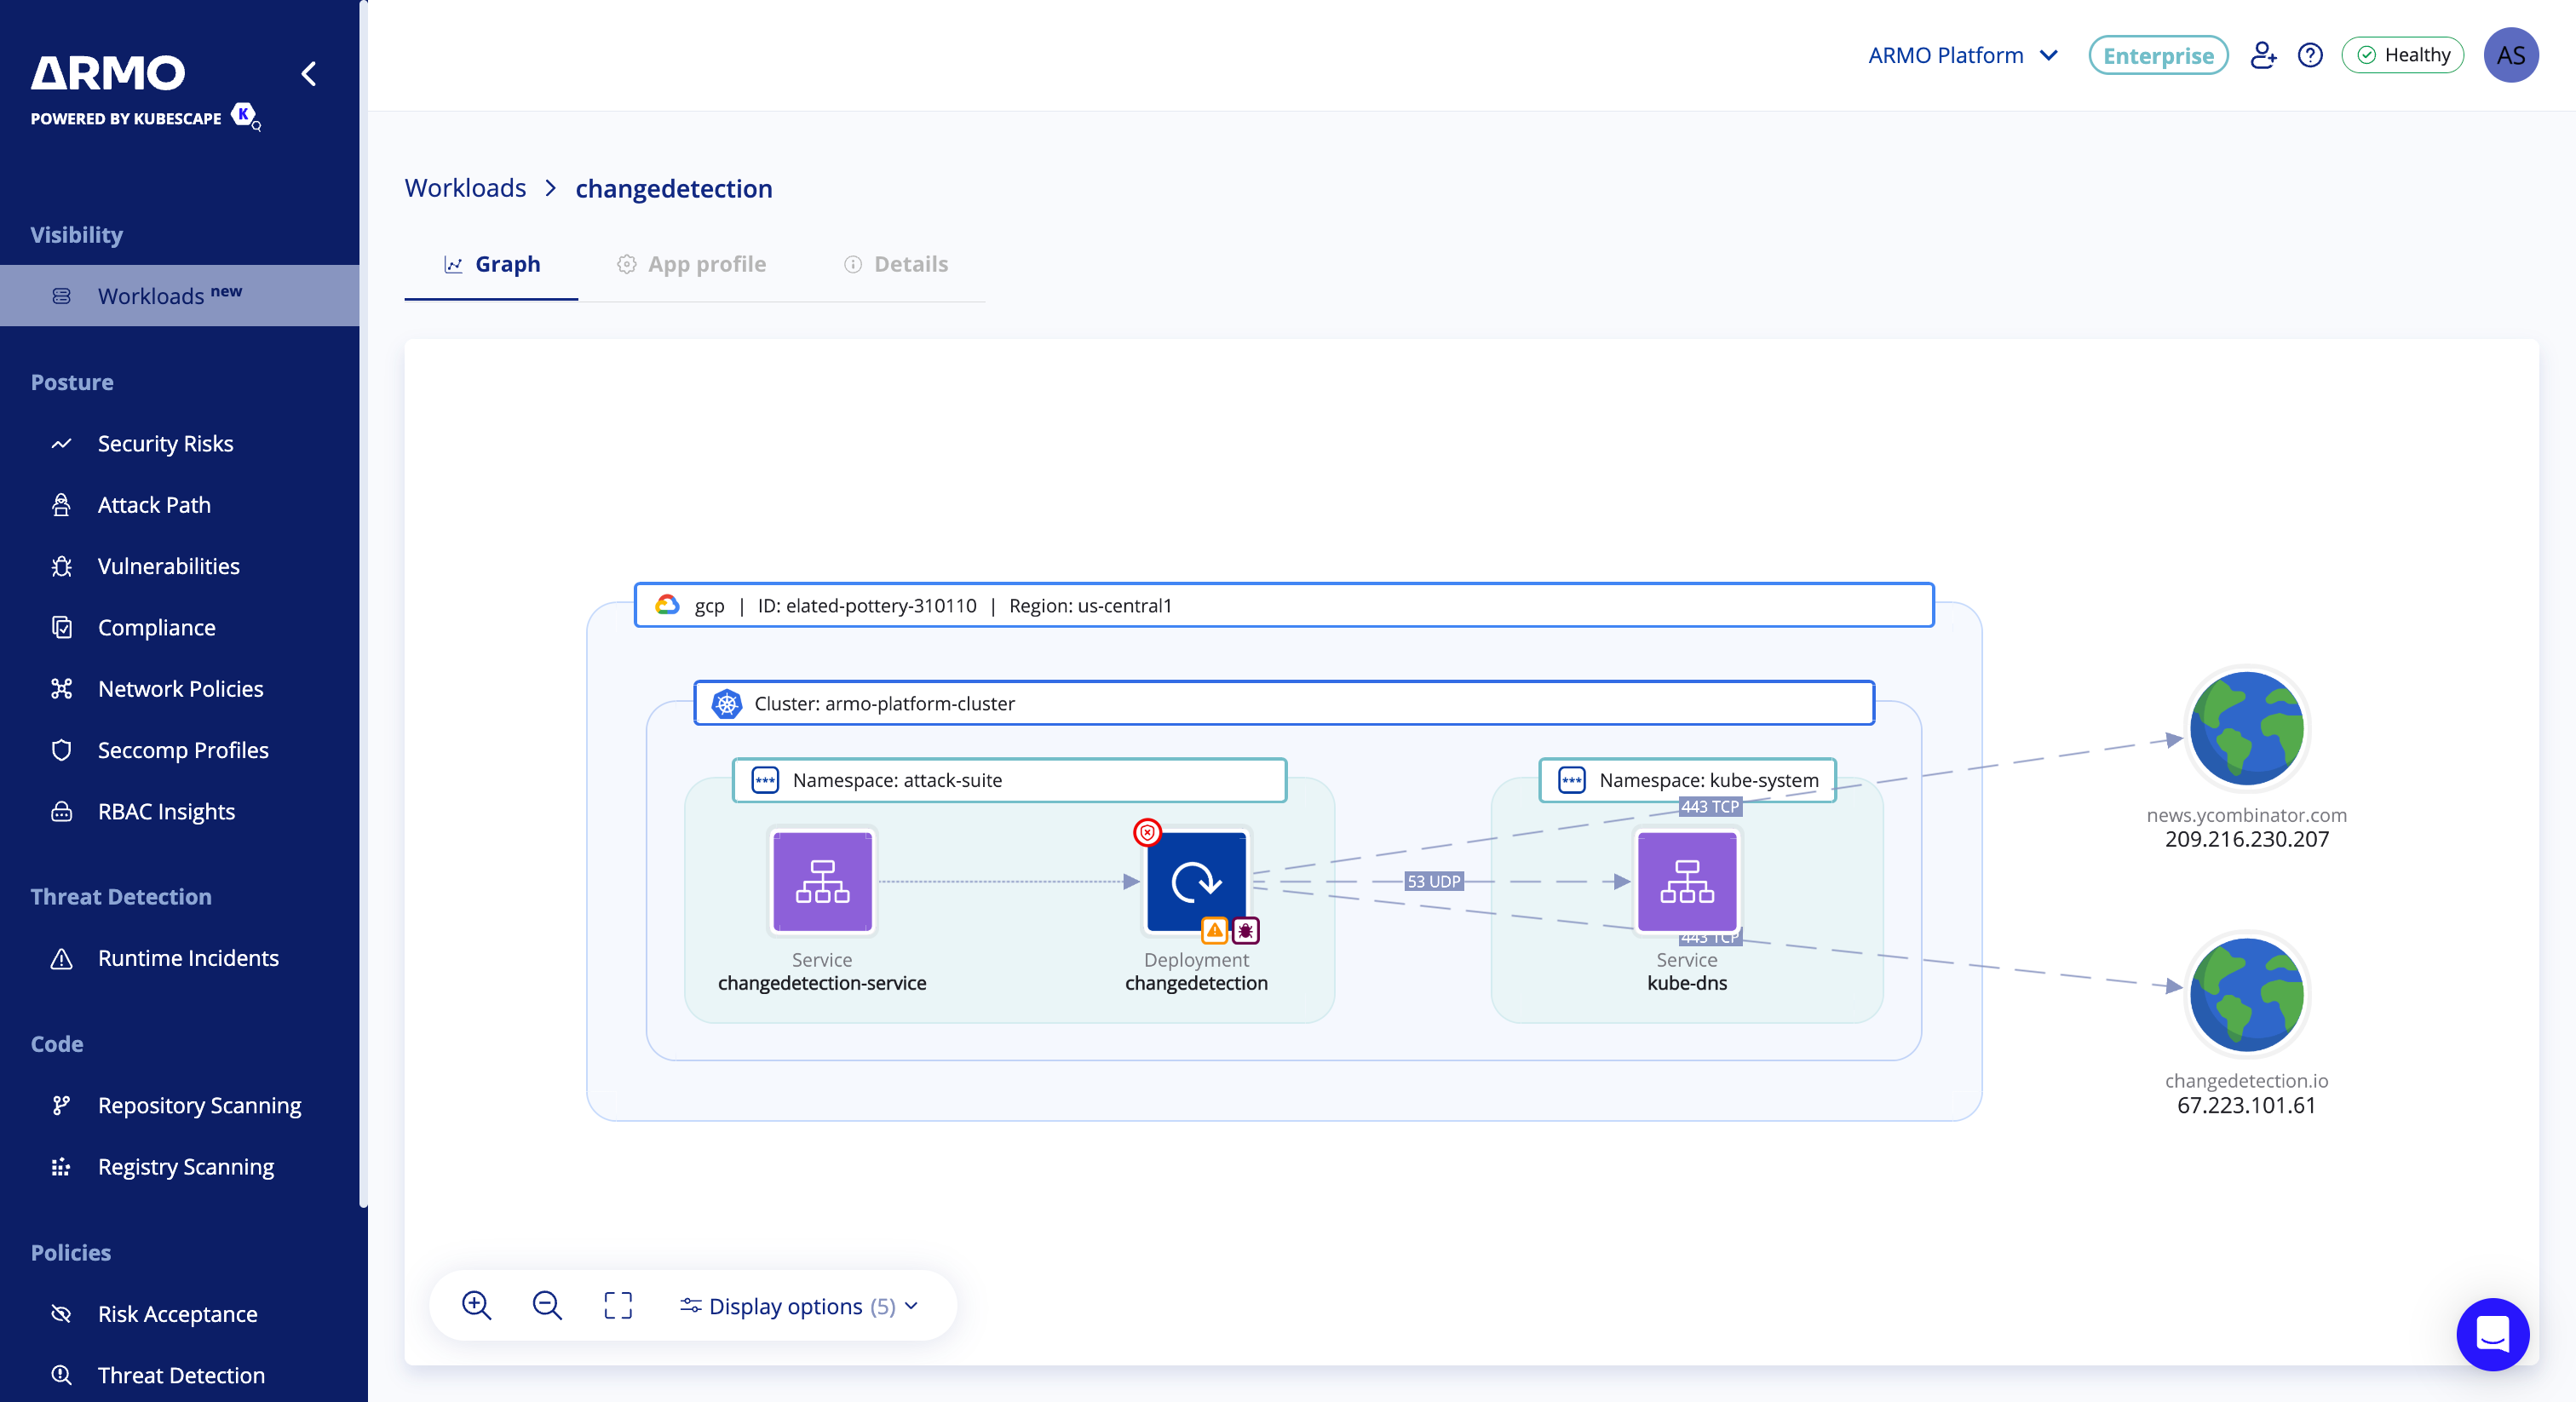
Workload Drill-Down
Clicking on any workload in the table opens a dedicated Workload Page, organized into three tabs:
1. Graph
Visualizes the workload's runtime context. Includes:
- Observed Network Connections (past 24 hours)
- Mounted Volumes and Resources
Users can toggle additional graph display options:
- Network Policy Status — Shows whether a connection is allowed or blocked by Kubernetes network policies
- Port and Protocol — Displays traffic details such as TCP/UDP and port numbers
- Vulnerabilities — Marks workloads with known CVEs associated with images
- Incidents — Marks workloads with detected security incidents
- Names — Shows workload names
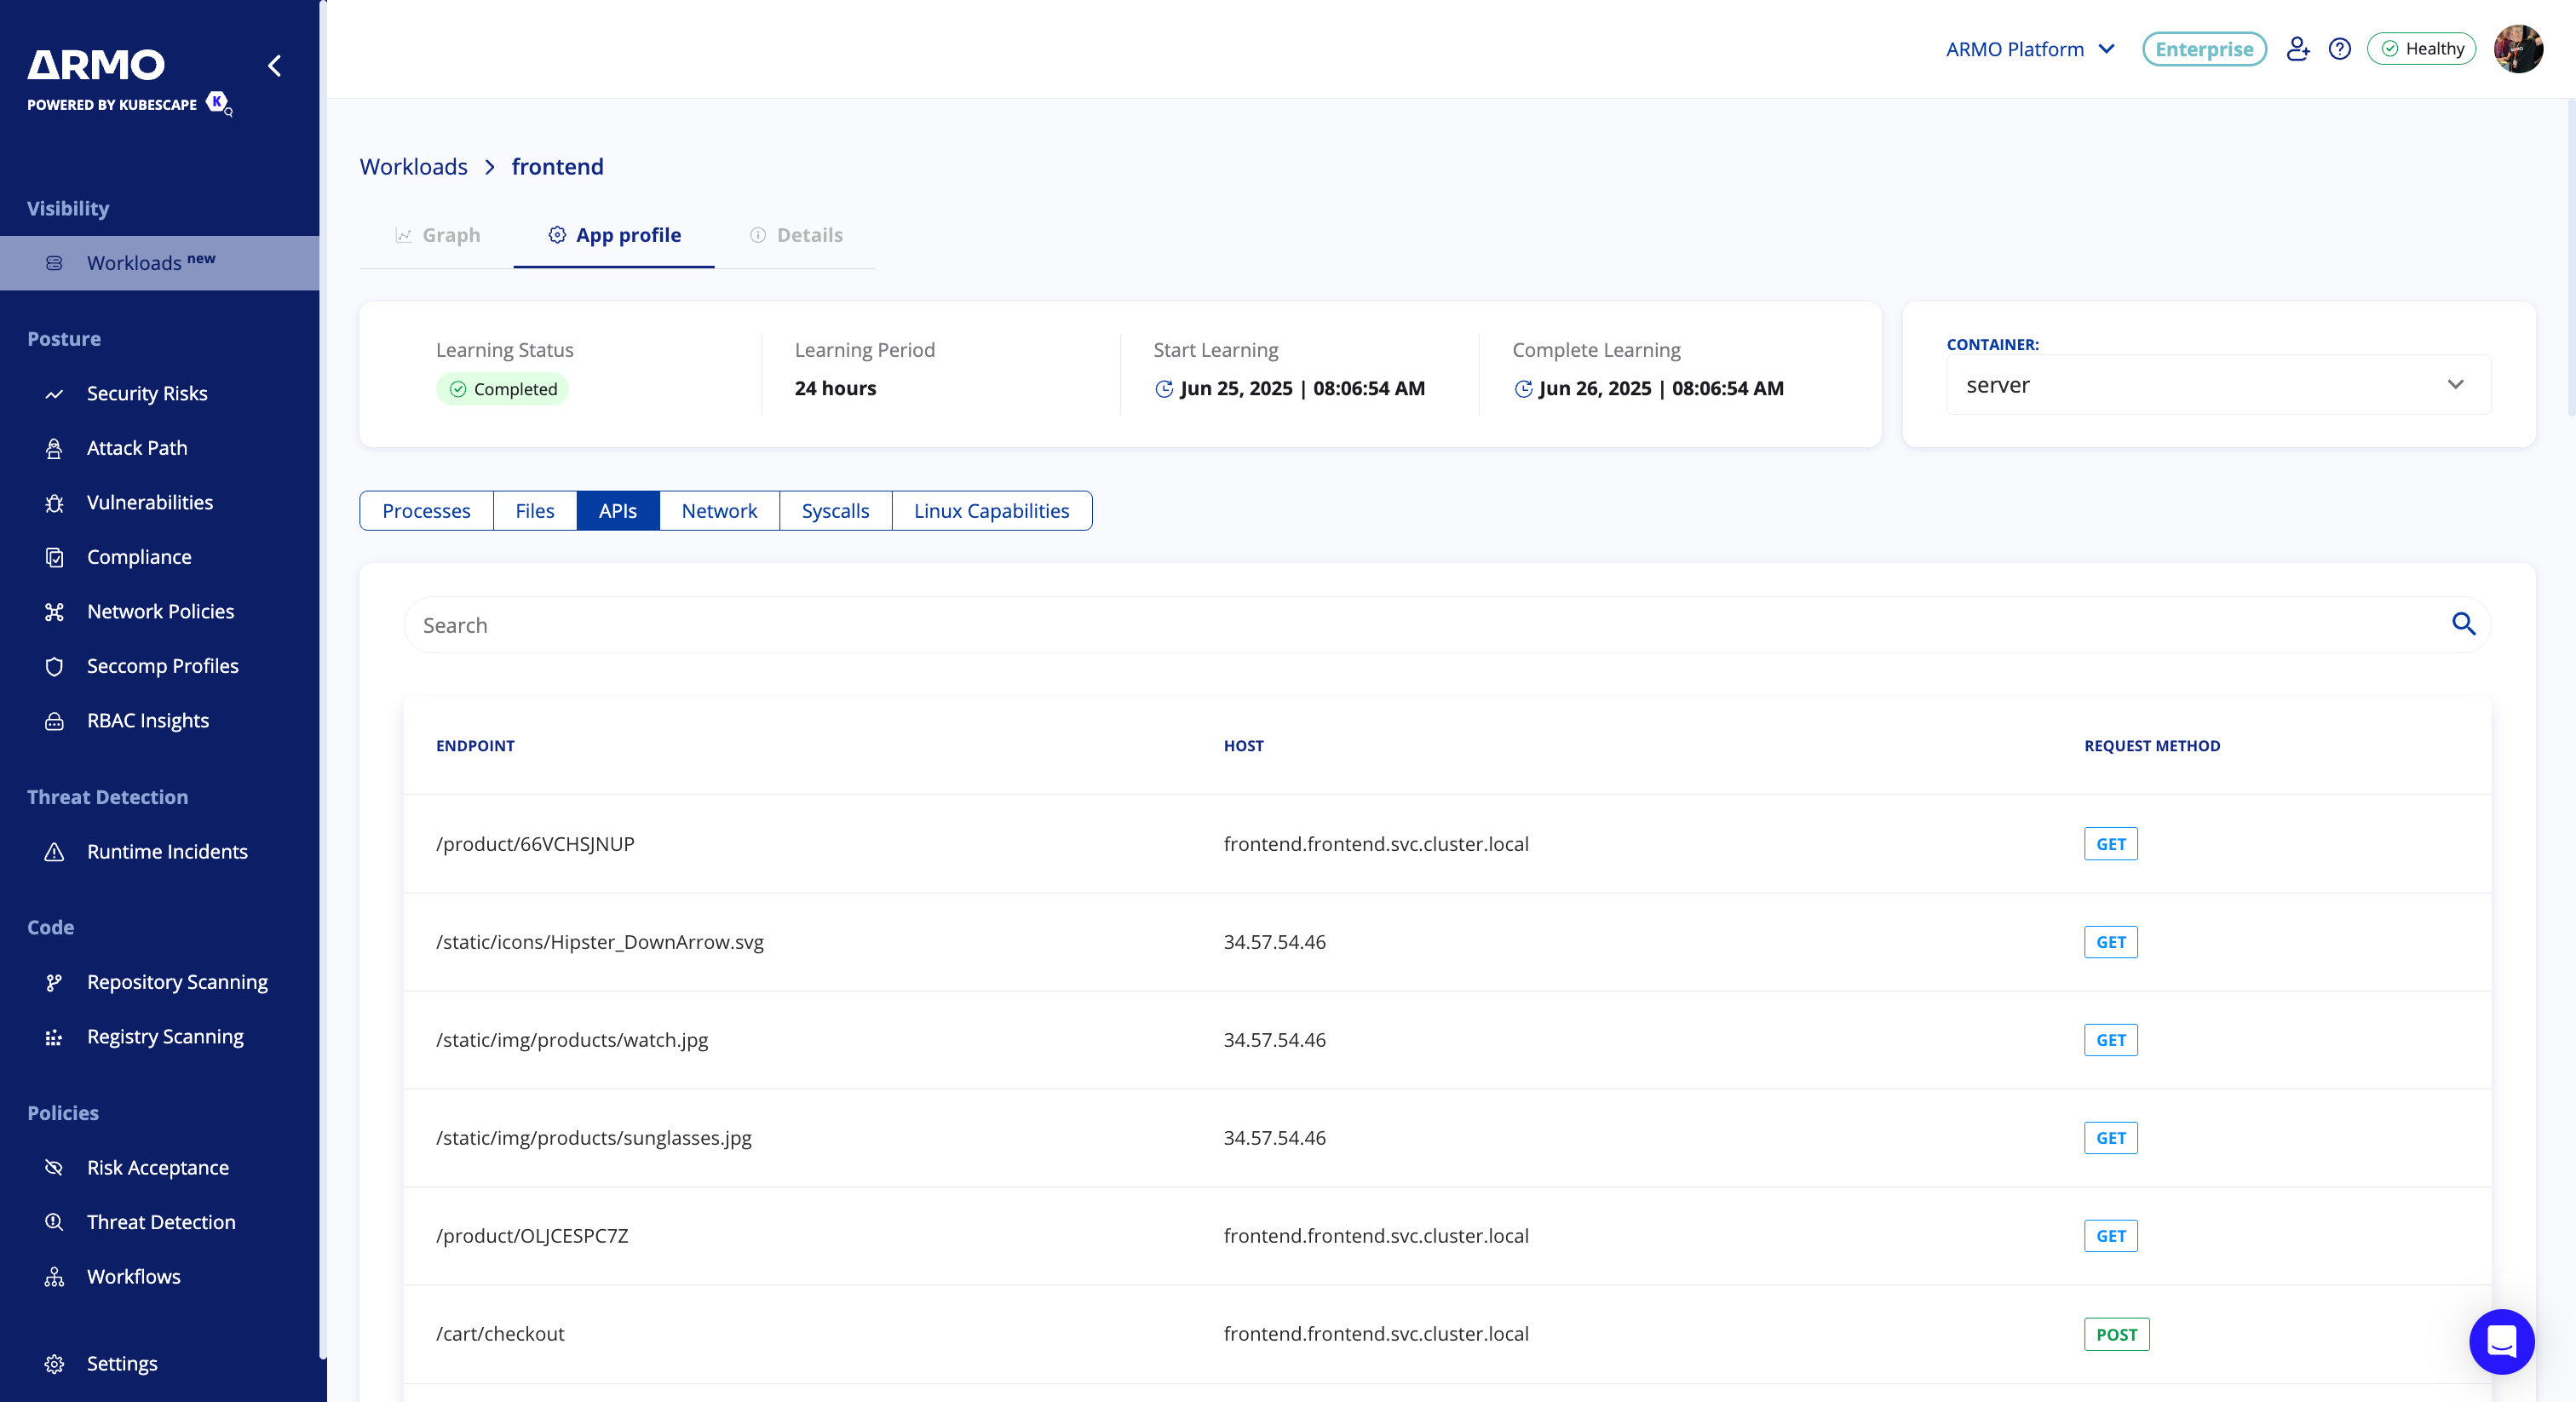
2. Application Profile
Gain deep visibility into how your workloads operate — and why that matters for security.
ARMO captures workload behavior to establish a baseline of normal activity, enabling anomaly detection and early threat identification.
By understanding the runtime profile of each workload, you shift from reactive alerting to proactive defense — spotting suspicious behavior, hardening configurations, and reducing risk before attackers can exploit it.
The application profile displays key runtime characteristics, including:
- Processes running inside the container
Malicious or unexpected processes are a clear sign something’s wrong. Seeing which processes are running helps you detect suspicious activity - like cryptominers, reverse shells, or rogue binaries—before they cause damage. - Files accessed or modified
Security incidents often involve tampering with sensitive files—like config files, secrets, or logs. Monitoring file access lets you spot abnormal behavior, such as attempts to read token files or modify binaries inside the container. - API calls made
Workloads calling unexpected internal or external APIs could signal data exfiltration, privilege escalation, or lateral movement. Tracking these calls gives you deep visibility into how an application is behaving across your environment. - Network traffic
Unexpected connections to external or internal services can indicate command-and-control communication, data leakage, or lateral movement. By monitoring network flows, you can detect abnormal communication patterns and enforce least-privilege access. - Linux capabilities in use
Containers should run with minimal privileges. If a workload is using powerful Linux capabilities (like CAP_SYS_ADMIN or CAP_NET_RAW), it may be over-privileged—making it easier for attackers to exploit the container or host system. - Syscalls (System Calls)
Syscalls are how a process interacts with the kernel—and attackers often exploit this layer. Tracking system calls helps detect behaviors like privilege escalation, process injection, or attempts to escape the container. It's a critical layer of visibility for runtime threat detection.
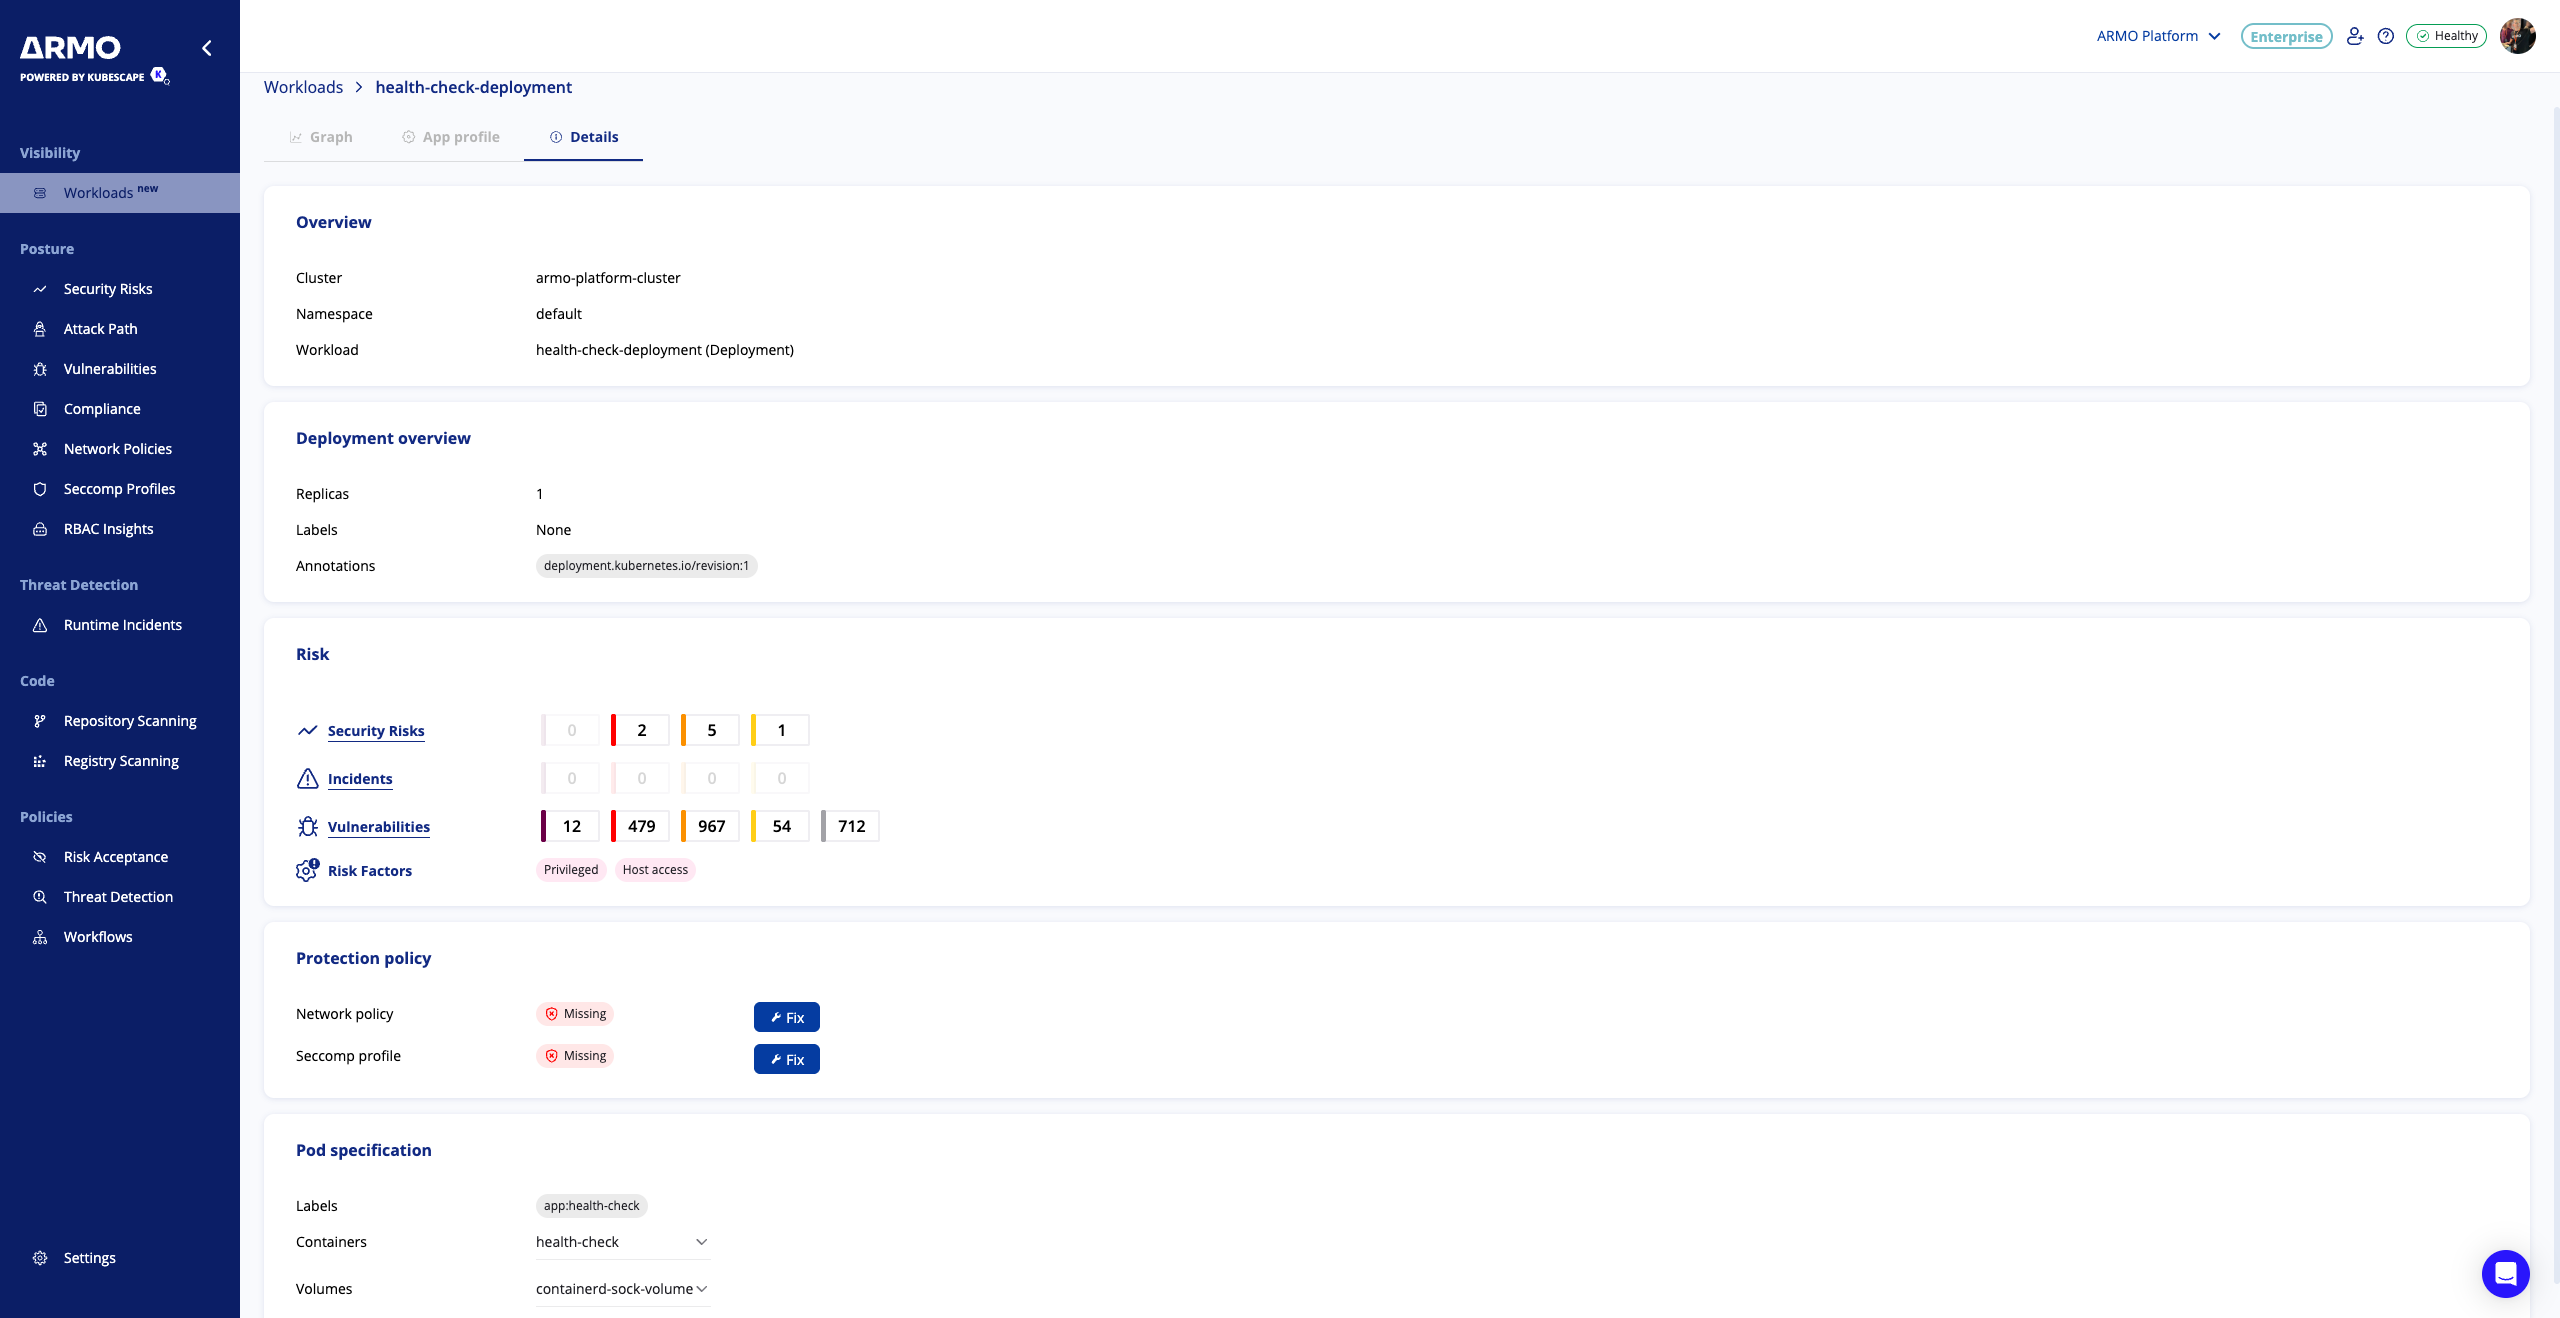
3. Details
Security Posture Overview
See exactly how each workload is secured - and why that matters for keeping your environment safe:
Misconfigurations
A single misconfiguration, like allowing privileged containers or disabling securityContext, can expose an entire cluster. Identifying and fixing misconfigurations reduces the attack surface and helps enforce Kubernetes security best practices.
Vulnerabilities
Outdated packages, libraries, or base images may contain known CVEs that attackers can exploit. Understanding which workloads are vulnerable allows you to prioritize patching based on actual risk, not guesswork.
Runtime incidents
Some risks only become visible at runtime—like containers behaving unexpectedly, accessing sensitive resources, or spawning suspicious processes. Monitoring runtime behavior gives you insight into threats that static scanning can’t detect.
Workload Risk Factors
Not all workloads are equally risky. Those exposed to the internet, running with elevated privileges, or lacking isolation controls pose a bigger threat. Identifying and scoring risk factors helps teams focus on the most critical workloads first.
Protection layers like network policies and seccomp profiles
These are your in-cluster security controls. Network policies limit which services can talk to each other, and seccomp profiles restrict dangerous system calls. Knowing which workloads have these protections in place, and which don’t, is key to enforcing zero trust principles and stopping lateral movement during attacks.
By combining configuration checks, runtime insights, and policy enforcement visibility,ARMO Platform gives you a real-world view of how secure each workload really is, not just in theory, but in practice.
Deployment Context
Quickly review workload specs, because understanding how a workload is configured is essential to evaluating its security posture:
Pod configuration, labels, and namespaces
Pod specs determine how containers run, including security settings like privilege escalation, read-only filesystems, and service accounts. Labels and namespaces help define trust boundaries and access policies. Security teams need this context to understand whether workloads are appropriately isolated, restricted, and governed.
Container images
The base image defines what software is in the container, and what vulnerabilities it might carry. If you're running outdated or untrusted images, you’re increasing your exposure. Tracking which images are used helps enforce image hygiene, version control, and allowlists.
Ports and exposed services
Open ports can unintentionally expose internal services to external traffic. Knowing which ports are exposed allows teams to catch misconfigurations and enforce network controls, before they become an entry point for attackers.
By combining this deployment metadata with runtime and risk insights, ARMO Platform helps you connect how a workload is built and deployed with how it behaves and how it’s secured. That’s essential for enforcing policy, detecting drift, and responding quickly when something looks suspicious.
All of this is available in a single unified view, no more jumping between tools or dashboards.
Updated 3 months ago