Custom Rules
Define Your Own Runtime Detection Logic Using eBPF Signals + CEL Expressions
Overview
ARMO’s Custom Rules framework allows security teams to extend ARMO’s behavioral detection engine with their own logic using Common Expression Language (CEL).
Custom Rules give you full control to detect emerging threats, workload-specific anomalies, and organization-specific behaviors, all powered by ARMO’s rich eBPF runtime telemetry.
Custom rules extend ARMO’s built-in detection library, enabling organizations to tailor security coverage for their unique workloads, compliance needs, and threat models.
Why Use Custom Rules?
Custom Rules let you:
- Detect behaviors unique to your workloads (e.g., internal tools, legacy binaries).
- Enforce security policies tailored to your environment.
- Create rules for new attack patterns before vendors update signatures.
- Reduce noise by writing rules that match your specific context.
- Combine process, filesystem, network, DNS, HTTP, syscall signals in a single expression.
Unlike traditional signature-based rule engines, ARMO rules operate over kernel-native eBPF signals, giving you deep visibility and low false positives.
Prerequisites
Before you start, ensure the following:
- You must have Administrator or Manager access in ARMO in order to create create custom rules.
- This feature is only available with Helm version 1.31.0 and above.
How Custom Rules Work
ARMO’s sensors collect real-time runtime activity using eBPF:
- Process execution
- Network connections
- DNS requests
- HTTP (L7) payload metadata
- File and directory access
- Syscall & capability usage
- SSH and interactive session indicators
These signals flow into ARMO’s Rule Engine. Each custom rule evaluates incoming event objects using a CEL expression. If the expression results in true, an incident is generated.
Custom Rule Fields
| Field | Description |
|---|---|
| Rule Name | A unique name identifying the rule. |
| Rule Description | A short explanation of what the rule detects or its purpose. |
| Severity | Defines the impact level if the rule triggers. |
| MITRE Tactic | Maps the rule to a MITRE ATT&CK Tactic. |
| MITRE Technique | Maps to a specific MITRE ATT&CK Technique ID. |
| Validation message | Use it to describe the violation or provide guidance for investigation |
| Trigger event | Defines which eBPF event type trigger this rule, such as process execution, DNS, file I/O, or network activity |
| Rule Expression Editor | The logic engine for the rule. Supports CEL (Common Expression Language). |
| Templates Drop-down | Quick-start CEL templates for common scenarios (e.g., detecting credential access, privilege escalation). |
| Rule Input | Defines the event source(s) the rule applies to (e.g., process, file, network). |
| Rule Output | Defines the result or action of the rule (e.g., true/false, match object). |
| Validate Rule Button | Runs syntax validation and test simulation. |
General Event Metadata (Applies to All Event Types)
The following fields are included in every runtime event, providing execution context, container identity, and process lineage.
They enable accurate correlation across events, workloads, and attack timelines.
Workload & Container Context
namespace
namespaceType: String
The Kubernetes namespace in which the container is running.
podName
podNameType: String
The name of the Kubernetes pod that triggered the event.
containerName
containerNameType: String
The name of the container inside the pod that triggered the event.
containerId
containerIdType: String
The unique runtime identifier of the container.
Process Context
pid
pidType: uint32
The Process ID (PID) of the process that generated the event.
comm
commType: String
The name of the process that generated the event.
ppid
ppidType: uint32
The Process ID (PID) of the parent process.
pcomm
pcommType: String
The name of the parent process.
Identity Context
uid
uidType: uint32
The Linux user ID under which the process is running.
Why This Metadata Matters
These fields allow you to:
- Correlate events across process trees and attack chains
- Understand who, where, and how an action occurred
- Build precise runtime policies with minimal false positives
- Enrich detections with Kubernetes and workload context
Best Practices
- Correlate events using
pidandppidto understand process lineage - Use namespace, pod, and container metadata to scope detections
- Treat events running as privileged users with elevated risk
- Combine general metadata with event-specific fields for high-confidence detections
What are the supported trigger event types and when to use them?
Exec event
Overview
Exec Events are generated whenever a new process is created inside a workload.
They provide detailed visibility into how, where, and from which context a process is executed, enabling advanced runtime security detections such as malicious execution paths, fileless attacks, and post-exploitation behavior.
Exec Events are commonly used for:
- Detecting suspicious process execution
- Identifying runtime file drops
- Monitoring execution from non-standard directories
- Building behavioral runtime policies
When Is an Exec Event Triggered?
An Exec Event is triggered each time a new process is created, including:
- Binary execution (
/bin/bash,/usr/bin/curl, etc.) - Script execution (Python, Node.js, shell scripts)
- Child processes spawned by another process
Event Fields
args
argsType: Array<String>
An ordered list of all arguments passed to the process at execution time.
Example:
["python", "malware.py", "--silent"]cwd
cwdType: String
The current working directory from which the process is executed.
Example:
/var/www/htmlexepath
exepathType: String
The absolute path of the executable file that is being launched.
Example:
/dev/shm/.xupperlayer
upperlayerType: Boolean
Indicates whether the executed file was created or modified after the base container image was built.
true→ Runtime-created or modified binaryfalse→ Binary originates from the original container image
Why it matters:
Runtime-created binaries are a strong indicator of compromise, fileless malware, or post-exploitation activity.
pupperlayer
pupperlayerType: Boolean
Indicates whether the parent process that spawned the current process originated from a runtime-created or modified file.
true→ Parent process is from the container’s writable layerfalse→ Parent process is from the base image
Why it matters:
Helps detect malicious process chains, not just individual executions.
Detecting Process Execution from Suspicious Paths
Directories such as /dev/shm are frequently abused by attackers because they:
- Are memory-backed
- Allow execution
- Are rarely used by legitimate applications
Example: Process Execution from /dev/shm
/dev/shmDetection Logic
(event.exepath == '/dev/shm' || event.exepath.startsWith('/dev/shm/')) ||
(event.cwd == '/dev/shm' || event.cwd.startsWith('/dev/shm/') ||
(parse.get_exec_path(event.args, event.comm).startsWith('/dev/shm/')))
What This Detects
- Executables launched directly from
/dev/shm - Processes executed with a working directory under
/dev/shm - Commands where the actual executable path is resolved from arguments and points to
/dev/shm
Open event
Overview
Open Events are generated whenever a file is accessed on the filesystem.
They provide visibility into file access behavior, including reads, writes, truncation, and file creation—making them a core signal for detecting configuration tampering, credential access, log manipulation, and persistence techniques.
Open Events are commonly used for:
- Detecting sensitive file access
- Monitoring unauthorized file modifications
- Identifying log tampering and evasion attempts
- Tracking persistence-related filesystem activity
When Is an Open Event Triggered?
An Open Event is triggered each time a file is opened, regardless of whether the operation succeeds or fails, and includes:
- Read access
- Write access
- File creation
- File truncation
- Append operations
Event Fields
path
pathType: String
The absolute filesystem path of the file being accessed.
Example:
/etc/passwdflags
flagsType: Array<String>
A parsed, human-readable representation of how the file is being accessed, derived from flagsRaw.
Common Values:
O_CREAT– Create the file if it does not existO_TRUNC– Truncate the file upon openingO_WRONLY– Open file for write-only accessO_RDWR– Open file for read and write accessO_APPEND– Append data to the end of the file
Example:
["O_WRONLY", "O_TRUNC"]flagsRaw
flagsRawType: uint32
The raw numeric value representing the file access flags as provided by the operating system.
Why it matters:
While flags is easier to reason about, flagsRaw allows for precise, low-level inspection and advanced detection logic when needed.
Detecting Access to Sensitive System Paths
Certain filesystem paths contain highly sensitive data or runtime state and are rarely accessed by normal application workloads.
Examples include:
/etc/– System configuration and credentials/var/log/– Application and system logs/var/run/– Runtime process and service state
Example: Access to Specific Files or Directories
Detection Logic
event.path.startsWith('/etc/') ||
event.path.startsWith('/var/log/') ||
event.path.startsWith('/var/run/')
What This Detects
- Reads or writes to system configuration files
- Attempts to modify or erase logs
- Access to runtime state files such as PID files or sockets
Link Event (Symlink / Hardlink)
Overview
Link Events are generated whenever a symbolic link (symlink) or hard link is created on the filesystem.
They provide visibility into filesystem redirection techniques, which are commonly abused for privilege escalation, persistence, credential theft, and defense evasion.
Link Events are especially important because links can silently redirect legitimate processes to sensitive or malicious files without modifying the original file path being accessed.
When Is a Link Event Triggered?
A Link Event is triggered each time a symlink or hardlink is created, including:
- Symlinks pointing to sensitive system files
- Hardlinks created to protected resources
- Runtime link creation inside writable container layers
Event Fields
exepath
exepathType: String
The absolute path of the executable (process) that created the symlink or hardlink.
Example:
/bin/lnoldPath
oldPathType: String
The target path the link points to (i.e., the destination file).
Example:
/etc/shadownewPath
newPathType: String
The filesystem location where the link itself is created.
Example:
/tmp/.shadow_linkupperlayer
upperlayerType: Boolean
Indicates whether the destination file (oldPath) was created or modified after the base container image was built.
true→ Target file exists in the writable (runtime) layerfalse→ Target file originates from the base image
Why it matters:
Links pointing to runtime-created files often indicate malicious redirection, persistence attempts, or preparation for privilege escalation.
Common Detection Use Case
Detecting Links to Sensitive System Files
Sensitive files such as /etc/shadow and /etc/sudoers should rarely—if ever—be linked by application workloads.
Creating links to these files can allow attackers to:
- Bypass file access controls
- Expose credentials indirectly
- Manipulate privileged behavior via symlink attacks
Example: Symlink or Hardlink Created Over Sensitive Files
Detection Logic
(event.oldPath.startsWith('/etc/shadow') ||
 event.oldPath.startsWith('/etc/sudoers'))
What This Detects
- Links pointing to credential stores
- Attempts to redirect access to privilege-related configuration files
- Preparation steps for privilege escalation or data exfiltration
Why This Matters
Link Events help identify:
- Symlink race attacks
- Privilege escalation techniques
- Credential exposure via filesystem redirection
- Persistence mechanisms using indirect file access
Because links do not modify the original file, they are often used to evade traditional file integrity monitoring.
Network Event
Overview
Network Events are generated whenever network activity is detected.
They provide real-time visibility into incoming and outgoing connections, enabling detection of command-and-control (C2) communication, cryptomining activity, data exfiltration, and lateral movement.
Network Events are a core signal for identifying malicious behavior that cannot be detected through filesystem or process monitoring alone.
When Is a Network Event Triggered?
A Network Event is triggered each time a network connection is observed, including:
- Outbound connections to external destinations
- Inbound connections to workloads or hosts
- Internal east-west traffic between services
Event Fields
dstAddr
dstAddrType: String
The destination IP address involved in the network connection.
Example:
45.83.193.21dstPort
dstPortType: uint16
The destination port number used in the connection.
Example:
3333pktType
pktTypeType: String
Indicates the direction of the network connection.
Possible Values:
OUTGOING– Connection initiated by the workloadINCOMING– Connection initiated toward the workload
Example:
OUTGOINGproto
protoType: String
The network protocol used for the connection.
Common Values:
TCPUDPICMP
Example:
TCPCommon Detection Use Case
Detecting Cryptomining-Related Network Communication
Cryptominers often communicate with mining pools over well-known ports.
Detecting outbound connections to these ports is a strong indicator of unauthorized cryptomining activity.
Example: Cryptomining Network Detection
Detection Logic
event.proto == 'TCP' &&
event.pktType == 'OUTGOING' &&
event.dstPort in [3333, 45700]
What This Detects
- Outbound TCP connections
- Traffic initiated by the workload
- Communication to ports commonly associated with cryptomining pools
Why This Matters
Network Events enable detection of:
- Command-and-control (C2) communication
- Cryptomining activity
- Data exfiltration attempts
- Lateral movement across workloads or hosts
Because attackers often rely on external communication, Network Events provide a critical signal for identifying active threats.
DNS Event
Overview
DNS Events are generated whenever a DNS request or response is detected.
They provide visibility into domain resolution behavior, which is critical for detecting command-and-control (C2) communication, data exfiltration, domain generation algorithms (DGA), and suspicious external dependencies.
DNS Events are especially valuable because DNS activity often occurs before any network connection is established.
When Is a DNS Event Triggered?
A DNS Event is triggered each time a DNS request or response is observed, including:
- Internal service name resolution
- External domain lookups
- Runtime-introduced DNS dependencies
Event Fields
name
nameType: String
The domain name returned in the DNS response.
Example:
api.evil-domain.xyzdstIp
dstIpType: String
The destination IP address returned by the DNS resolution.
Example:
185.199.110.153dstPort
dstPortType: uint16
The destination port used for the DNS communication.
Example:
53srcPort
srcPortType: uint16
The source port from which the DNS request originated.
Example:
43218proto
protoType: String
The protocol used for the DNS request.
Common Values:
UDPTCP
Example:
UDPexePath
exePathType: String
The absolute path of the executable that initiated the DNS request.
Example:
/usr/bin/curlcwd
cwdType: String
The current working directory of the process performing the DNS lookup.
Example:
/appCommon Detection Use Case
Detecting DNS Anomalies in Containers
In Kubernetes environments, most legitimate DNS traffic resolves internal service names, typically ending with:
.svc.cluster.local.DNS queries outside this namespace may indicate:
- External callbacks
- Malicious dependencies
- Runtime compromise
Example: DNS Anomaly Detection
Detection Logic
!event.name.endsWith('.svc.cluster.local.')What This Detects
- DNS queries to external domains
- Unexpected runtime domain lookups
- Potential C2 or exfiltration endpoints
Why This Matters
DNS Events help identify:
-
Command-and-control infrastructure
-
Malware beaconing
-
Suspicious third-party dependencies
-
Early-stage attacks before network connections
Because DNS is often the first observable signal, it enables early detection and fast response.
Capabilities Event
Overview
Capabilities Events are generated whenever a process requests Linux capabilities.
Linux capabilities break down the traditional all-powerful root privileges into smaller, discrete permissions. While this improves security, certain capabilities remain extremely powerful and are rarely required by normal application workloads.
Monitoring capability requests is critical for detecting privilege escalation attempts, container escapes, and misconfigured workloads.
When Is a Capabilities Event Triggered?
A Capabilities Event is triggered each time a process requests one or more Linux capabilities, including:
- Capabilities granted at container start
- Capabilities requested dynamically at runtime
- Privileged operations executed by processes
Event Fields
capName
capNameType: String
The name of the Linux capability being requested.
Example:
CAP_SYS_ADMINWhy it matters:
Some capabilities effectively grant near-root access to the system and should be treated as high-risk.
syscallName
syscallNameType: String
The system call that triggered the capability request.
Example:
mountWhy it matters:
Correlating the capability with the triggering system call provides context into why the privilege was requested.
Common Detection Use Case
Detecting CAP_SYS_ADMIN Capability Requests
CAP_SYS_ADMIN Capability RequestsCAP_SYS_ADMIN is one of the most powerful Linux capabilities and is often referred to as the “new root” because it enables a wide range of privileged operations, including:
- Mounting filesystems
- Modifying kernel parameters
- Performing container escape techniques
Most application containers should never request this capability.
Example: CAP_SYS_ADMIN Detection
CAP_SYS_ADMIN DetectionDetection Logic
event.capName == 'CAP_SYS_ADMIN'What This Detects
- Attempts to perform privileged system operations
- Potential container breakout preparation
- Misconfigured or overly permissive workloads
Why This Matters
Capabilities Events help identify:
- Privilege escalation attempts
- Container escape techniques
- Over-privileged containers
- Risky runtime behavior introduced after deployment
Because capability usage is strongly correlated with attack techniques, these events provide high-confidence security signals with low false positives.
SSH Event
Overview
SSH Events are generated whenever SSH activity is detected.
They provide visibility into interactive access attempts, remote administration behavior, and potential post-exploitation activity.
SSH access inside containers or cloud workloads is often unnecessary and may indicate:
- Unauthorized remote access
- Persistence mechanisms
- Lateral movement attempts
- Misconfigured or overly permissive environments
When Is an SSH Event Triggered?
An SSH Event is triggered each time SSH traffic is observed, including:
- Outbound SSH connections initiated by workloads
- Inbound SSH access attempts
- SSH traffic over non-standard ports
Event Fields
dstIp
dstIpType: String
The destination IP address of the SSH connection.
Example:
203.0.113.45dstPort
dstPortType: uint16
The destination port used for the SSH connection.
Example:
22srcPort
srcPortType: uint16
The source port from which the SSH connection originated.
Example:
45123Common Detection Use Case
Disallowing Unauthorized SSH Connections
Legitimate SSH servers typically listen on well-known ports such as:
22(default)2022(commonly used alternative)
SSH connections initiated from ephemeral source ports to non-standard destination ports are often associated with:
- Backdoor access
- Tunneling
- Lateral movement attempts
Example: Disallowed SSH Connection Detection
Detection Logic
dyn(event.srcPort) >= 32768 &&
dyn(event.srcPort) <= 60999 &&
!(dyn(event.dstPort) in [22, 2022])
What This Detects
- SSH connections initiated from ephemeral source ports
- SSH traffic targeting non-standard destination ports
- Potential unauthorized or hidden SSH services
Why This Matters
SSH Events help identify:
- Unauthorized remote access
- Persistence via hidden SSH services
- Lateral movement between workloads or hosts
- Policy violations in production environments
Because SSH is a powerful administrative protocol, any unexpected usage should be treated as high risk.
Syscall Event
Overview
Syscall Events are generated whenever a system call is detected.
System calls form the lowest-level interface between user-space processes and the Linux kernel. Monitoring specific syscalls enables detection of advanced attack techniques that often bypass higher-level security controls.
Syscall Events are particularly effective for identifying stealthy runtime attacks, debugging abuse, and container escape attempts.
When Is a Syscall Event Triggered?
A Syscall Event is triggered each time a monitored system call is invoked, including:
- Debugging and tracing syscalls
- Privilege-related kernel interactions
- Low-level process manipulation
Event Fields
syscallName
syscallNameType: String
The name of the system call that was invoked.
Example:
ptraceWhy it matters:
Certain syscalls are rarely used by normal application workloads and are strongly associated with malicious behavior.
Common Detection Use Case
Detecting Use of ptrace
ptraceThe ptrace syscall is commonly used for:
- Process introspection and manipulation
- Credential harvesting from memory
- Code injection and runtime tampering
- Debugging or hooking running processes
In production containers, ptrace usage is highly suspicious.
Example: ptrace Syscall Detection
ptrace Syscall DetectionDetection Logic
syscallname == 'ptrace'What This Detects
- Attempts to attach to or inspect running processes
- Potential credential dumping or code injection
- Preparation for privilege escalation or container escape
Why This Matters
Syscall Events help detect:
- Memory inspection and manipulation
- Process injection attacks
- Advanced persistence techniques
- Low-level exploitation attempts
Because syscalls sit at the kernel boundary, they offer high-fidelity security signals with minimal noise.
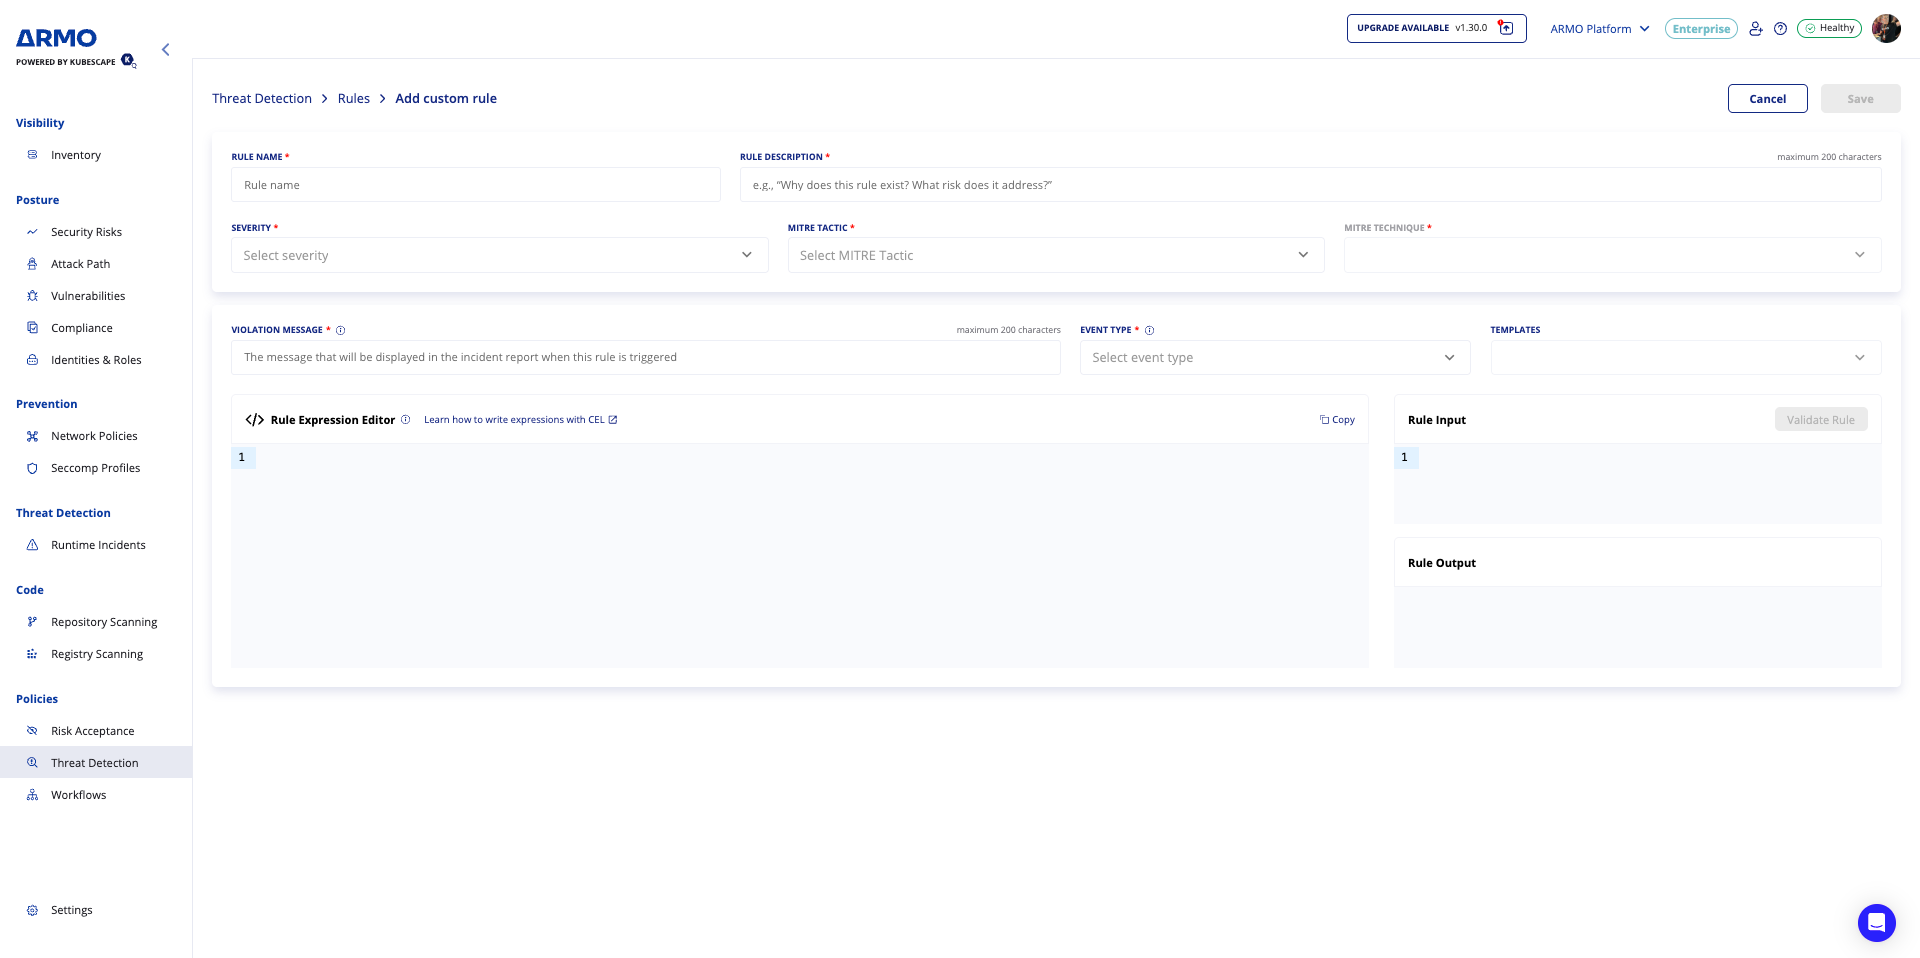
How to create a custom rule?
- Navigate to Policies → Threat Detection → Rules → Add Custom Rule.
- Fill in all required fields using the guided form.
- Optionally use a template or the Learn CEL link to speed up authoring.
- Validate the rule using Validate Rule before saving.
- Save the Rule → The new rule appears in the Rules Table, where it can be enabled, disabled, cloned, or edited.
- Create a policy and select the created rule
Example - DNS Anomalies in Container
This custom rule is designed to detect outbound DNS queries from a container to domains that are not part of the Kubernetes cluster’s internal service domain and not part of the known/allowed egress destinations.
!event.name.endsWith('.svc.cluster.local.')
&&
  !nn.is_domain_in_egress(event.containerId, event.name)
Let’s break it down:
Condition 1 - Identify external DNS queries
!event.name.endsWith('.svc.cluster.local.')This means the domain being queried is NOT an internal Kubernetes service. Internal cluster services always end with: *.svc.cluster.local.
If the domain does not end with that suffix → it is external.
Condition 2 - Identify new, suspicious, or anomalous outbound domains
!nn.is_domain_in_egress(event.containerId, event.name)This means the domain is not in the allowed egress domains for this specific container. The condition checks the workload’s learned DNS baseline (based on eBPF network observations). If false, the domain has never been observed before as part of normal behavior.
Final Detection Logic
The rule triggers when a container makes a DNS request to an external domain that it has never queried before. This is effectively detect anomalous outbound DNS queries to previously unseen external domains.
Error Handling
- All required fields must be filled before saving.
- Invalid CEL expressions block saving until corrected.
- Validation feedback is displayed inline with clear error messages.
- Duplicate Rule Names trigger a unique name error.
- Maximum character limits are enforced automatically.
Updated about 1 month ago